TrendShield Pro | DinkanWorldSmart Trailing Trend System Powered by EMA + ATR
TrendShield Pro is a powerful trend detection and trailing stop indicator designed for traders who rely on pure price movement and volatility tracking.
It dynamically adapts to market conditions using a combination of EMA (Exponential Moving Average) and ATR (Average True Range) to identify the active trend and place a visual trailing stop line.
🔍 How It Works
TrendShield Pro combines trend direction and volatility to create a self-adjusting trailing system:
EMA (Exponential Moving Average):
Smooths price fluctuations and identifies the overall market bias.
ATR (Average True Range):
Measures volatility to determine how far the trailing stop should follow the trend.
Dynamic Bands:
Two invisible thresholds are formed — up and down — around the EMA using the ATR and your chosen Factor value.
Trailing Logic:
When the EMA is rising, the Trailing Stop (TUp) locks in higher lows.
When the EMA is falling, the Trailing Stop (TDown) locks in lower highs.
The indicator switches trend automatically based on price crossing these trailing levels.
🧭 Visuals & Features
Green Trailing Line (Demand Trend): Indicates an active bullish trend.
Red Trailing Line (Supply Trend): Indicates an active bearish trend.
Arrow Signals:
🟢 Up Arrow → Bullish Trend Reversal
🔴 Down Arrow → Bearish Trend Reversal
Diamond Markers: Show points where the trailing line shifts, marking dynamic volatility changes.
⚙️ Inputs
Input Description
EMA Period Length of the Exponential Moving Average
ATR Period Period used for Average True Range calculation
Factor Multiplier for ATR-based volatility expansion
"Trailing stop" için komut dosyalarını ara

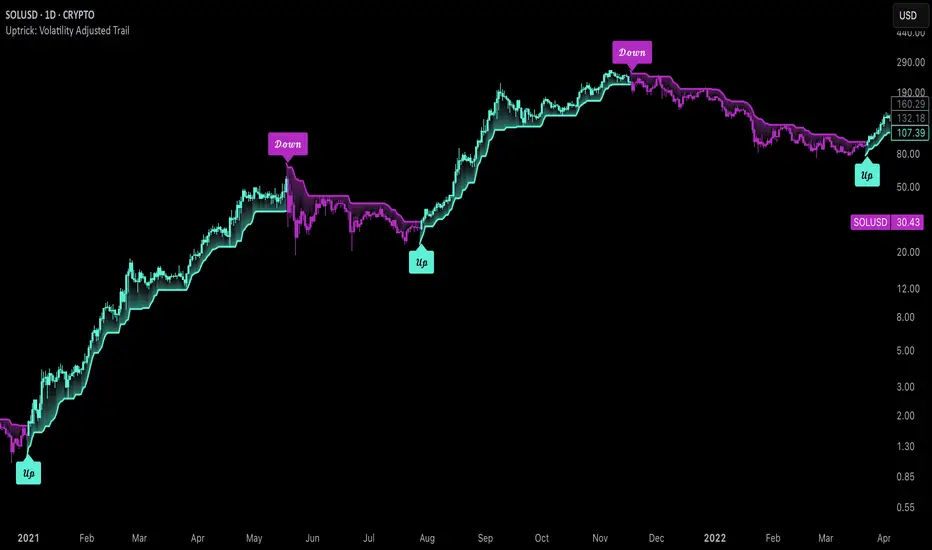
Uptrick: Volatility Adjusted TrailIntroduction
The "Uptrick: Volatility Adjusted Trail" is a dynamic trailing band indicator. It adapts in real time to changing market conditions by adjusting both to volatility and trend consistency. Inspired by Supertrend-style logic, it enhances traditional approaches by introducing adaptive mechanisms for more context-sensitive behavior in both trending and consolidating environments.
Overview
This indicator combines an exponential moving average (EMA) as its basis with an Average True Range (ATR)-derived multiplier that adjusts dynamically. Unlike fixed-multiplier tools, this indicator modifies its band distances in real time according to volatility expansion and trend persistence. The result is a trailing system that adapts to the prevailing market regime, providing traders with clearer signals for trend bias, stop placement, and potential momentum shifts.
Originality
The script’s originality lies in its multi-layered approach to trail calculation. It introduces a real-time ATR multiplier adjustment driven by two factors: a volatility expansion ratio and a trend persistence model. The expansion ratio compares the current ATR to its moving average, making the indicator more sensitive during volatile conditions and less sensitive during quieter periods. The trend persistence model assesses directional consistency to widen the bands during sustained trends. This dual adjustment method creates a system that evolves with market behavior, making it more responsive and adaptive than static-band or fixed-multiplier alternatives.
Components & Inspiration
This indicator was designed with specific components that work together:
Exponential Moving Average (EMA): Chosen as the central baseline because it responds faster to recent price changes than a simple moving average, providing a more current reference for trailing bands.
Average True Range (ATR): Used as the volatility measure because it accounts for both intraday and gap movement, making it a robust and widely accepted standard for market volatility.
Dynamic Multiplier: The multiplier is adjusted by both volatility expansion and trend persistence to produce bands that tighten during low volatility and widen during consistent trends. This combination was chosen to give the indicator the ability to self-regulate across different market regimes.
Trend Persistence Model: Integrated to assess directional consistency, ensuring the bands expand during strong trends, which can prevent premature stop-outs.
Flip Confirmation Logic: Added to filter out noise by requiring multiple bar closes beyond a band before confirming a state change, reducing false reversals.
For inspiration, the indicator draws on the core idea behind Supertrend—using a baseline and volatility-derived bands to define trailing stop levels. However, while Supertrend uses a fixed ATR multiplier, this indicator introduces a dynamic multiplier system and persistence weighting, making it more adaptive and suited for varying conditions.
Inputs and Parameters
Basis EMA Length
Defines the period for the EMA that serves as the core price reference.
ATR Length
Sets the lookback period for the Average True Range calculation used in band spacing.
Base ATR Mult
The base multiplier applied to ATR before adjustments. Forms the starting scale of the band offset.
Volatility Expansion Sensitivity
Controls how strongly the band spacing reacts to short-term volatility bursts. Higher values create more pronounced band expansions or contractions.
Trend Persistence Window
Determines how many bars are used to calculate directional trend consistency using a smoothed step function.
Persistence Impact
Scales how much influence the trend persistence has on band widening. Values range from 0 (no effect) to 1 (maximum effect).
Min Effective Mult
Sets the minimum value that the adjusted multiplier can reach. Prevents the bands from becoming too narrow.
Max Effective Mult
Sets the maximum value the adjusted multiplier can reach. Prevents the bands from over-expanding during high volatility.
Bars Above/Below to Confirm Flip
Number of consecutive bars required to close above or below the opposing trail before confirming a bullish or bearish flip. Helps reduce noise and false signals.
Show Flip Labels
Enables or disables the display of flip markers on the chart.
Label Size
Allows users to adjust the size of flip labels from Tiny to Huge.
Label ATR Offset
Adjusts the vertical placement of flip labels in relation to the trail using an ATR-based offset.
Features and Logic
EMA Basis: All calculations stem from an EMA that tracks the centerline of price action.
Dynamic ATR Multiplier: The ATR multiplier adjusts in real time based on volatility expansion and trend persistence.
Clamped Multiplier: The adjusted multiplier is limited between user-defined minimum and maximum values to keep the band scale practical.
Upper and Lower Bands: Bands are plotted above and below the EMA using the dynamic multiplier and ATR values.
Trailing Logic: The script uses Supertrend-style trailing logic, updating the active band in the current trend direction and resetting the opposite band.
Trend State Detection: A state variable tracks the current market regime (bullish, bearish, or neutral). Transitions are confirmed only after a user-specified number of bars close beyond the respective bands.
Visual Elements: Trail lines and fill zones are color-coded (bullish cyan, bearish magenta). Candlestick and bar colors match the trend state. Optional flip labels mark confirmed transitions.
Alerts: Built-in alert conditions allow users to receive real-time notifications for bullish or bearish flips.
Usage Guidelines
This indicator can be used for:
Defining context-aware dynamic stop levels that adjust with market behavior.
Identifying trend direction and reversal points based on adaptive logic.
Filtering entry or exit signals during trending vs. consolidating conditions.
Supplementing trade management strategies with responsive visual markers.
Entering long or short positions based on the appearance of flip labels and managing stop losses by following the adaptive trail.
Traders may tune the parameters to suit different trading styles or timeframes. For example, lower ATR and EMA values may suit intraday setups, while longer settings may benefit swing or positional trading.
Summary
The "Uptrick: Volatility Adjusted Trail" provides a flexible, adaptive trailing band system that accounts for both volatility and directional consistency. By combining an EMA baseline with a dynamic ATR multiplier influenced by volatility expansion and trend persistence, it creates a context-sensitive trailing system that aligns with changing market conditions. Customizable confirmation, flip labels, alerts, and dynamic visual cues make it a versatile tool for trend-following, breakout filtering, and trailing stop logic.
Disclaimer
This indicator is provided for educational and research purposes only. It does not constitute financial advice. Trading involves risk, and past performance does not guarantee future results. Always conduct your own analysis and risk management before making trading decisions.
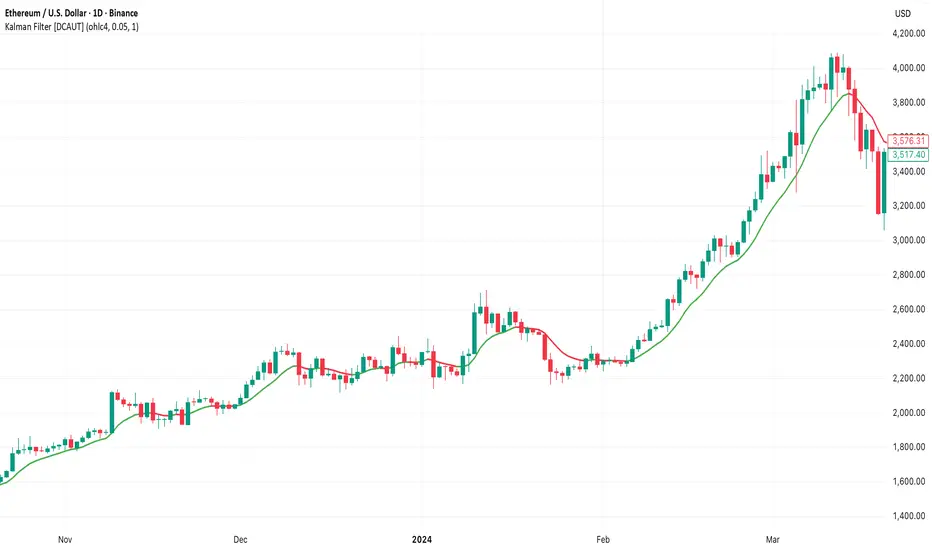
Kalman Filter [DCAUT]█ Kalman Filter
📊 ORIGINALITY & INNOVATION
The Kalman Filter represents an important adaptation of aerospace signal processing technology to financial market analysis. Originally developed by Rudolf E. Kalman in 1960 for navigation and guidance systems, this implementation brings the algorithm's noise reduction capabilities to price trend analysis.
This implementation addresses a common challenge in technical analysis: the trade-off between smoothness and responsiveness. Traditional moving averages must choose between being smooth (with increased lag) or responsive (with increased noise). The Kalman Filter improves upon this limitation through its recursive estimation approach, which continuously balances historical trend information with current price data based on configurable noise parameters.
The key advancement lies in the algorithm's adaptive weighting mechanism. Rather than applying fixed weights to historical data like conventional moving averages, the Kalman Filter dynamically adjusts its trust between the predicted trend and observed prices. This allows it to provide smoother signals during stable periods while maintaining responsiveness during genuine trend changes, helping to reduce whipsaws in ranging markets while not missing significant price movements.
📐 MATHEMATICAL FOUNDATION
The Kalman Filter operates through a two-phase recursive process:
Prediction Phase:
The algorithm first predicts the next state based on the previous estimate:
State Prediction: Estimates the next value based on current trend
Error Covariance Prediction: Calculates uncertainty in the prediction
Update Phase:
Then updates the prediction based on new price observations:
Kalman Gain Calculation: Determines the weight given to new measurements
State Update: Combines prediction with observation based on calculated gain
Error Covariance Update: Adjusts uncertainty estimate for next iteration
Core Parameters:
Process Noise (Q): Represents uncertainty in the trend model itself. Higher values indicate the trend can change more rapidly, making the filter more responsive to price changes.
Measurement Noise (R): Represents uncertainty in price observations. Higher values indicate less trust in individual price points, resulting in smoother output.
Kalman Gain Formula:
The Kalman Gain determines how much weight to give new observations versus predictions:
K = P(k|k-1) / (P(k|k-1) + R)
Where:
K is the Kalman Gain (0 to 1)
P(k|k-1) is the predicted error covariance
R is the measurement noise parameter
When K approaches 1, the filter trusts new measurements more (responsive).
When K approaches 0, the filter trusts its prediction more (smooth).
This dynamic adjustment mechanism allows the filter to adapt to changing market conditions automatically, providing an advantage over fixed-weight moving averages.
📊 COMPREHENSIVE SIGNAL ANALYSIS
Visual Trend Indication:
The Kalman Filter line provides color-coded trend information:
Green Line: Indicates the filter value is rising, suggesting upward price momentum
Red Line: Indicates the filter value is falling, suggesting downward price momentum
Gray Line: Indicates sideways movement with no clear directional bias
Crossover Signals:
Price-filter crossovers generate trading signals:
Golden Cross: Price crosses above the Kalman Filter line, suggests potential bullish momentum development, may indicate a favorable environment for long positions, filter will naturally turn green as it adapts to price moving higher
Death Cross: Price crosses below the Kalman Filter line, suggests potential bearish momentum development, may indicate consideration for position reduction or shorts, filter will naturally turn red as it adapts to price moving lower
Trend Confirmation:
The filter serves as a dynamic trend baseline:
Price Consistently Above Filter: Confirms established uptrend
Price Consistently Below Filter: Confirms established downtrend
Frequent Crossovers: Suggests ranging or choppy market conditions
Signal Reliability Factors:
Signal quality varies based on market conditions:
Higher reliability in trending markets with sustained directional moves
Lower reliability in choppy, range-bound conditions with frequent reversals
Parameter adjustment can help adapt to different market volatility levels
🎯 STRATEGIC APPLICATIONS
Trend Following Strategy:
Use the Kalman Filter as a dynamic trend baseline:
Enter long positions when price crosses above the filter
Enter short positions when price crosses below the filter
Exit when price crosses back through the filter in the opposite direction
Monitor filter slope (color) for trend strength confirmation
Dynamic Support/Resistance:
The filter can act as a moving support or resistance level:
In uptrends: Filter often provides dynamic support for pullbacks
In downtrends: Filter often provides dynamic resistance for bounces
Price rejections from the filter can offer entry opportunities in trend direction
Filter breaches may signal potential trend reversals
Multi-Timeframe Analysis:
Combine Kalman Filters across different timeframes:
Higher timeframe filter identifies primary trend direction
Lower timeframe filter provides precise entry and exit timing
Trade only in direction of higher timeframe trend for better probability
Use lower timeframe crossovers for position entry/exit within major trend
Volatility-Adjusted Configuration:
Adapt parameters to match market conditions:
Low Volatility Markets (Forex majors, stable stocks): Use lower process noise for stability, use lower measurement noise for sensitivity
Medium Volatility Markets (Most equities): Process noise default (0.05) provides balanced performance, measurement noise default (1.0) for general-purpose filtering
High Volatility Markets (Cryptocurrencies, volatile stocks): Use higher process noise for responsiveness, use higher measurement noise for noise reduction
Risk Management Integration:
Use filter as a trailing stop-loss level in trending markets
Tighten stops when price moves significantly away from filter (overextension)
Wider stops in early trend formation when filter is just establishing direction
Consider position sizing based on distance between price and filter
📋 DETAILED PARAMETER CONFIGURATION
Source Selection:
Determines which price data feeds the algorithm:
OHLC4 (default): Uses average of open, high, low, close for balanced representation
Close: Focuses purely on closing prices for end-of-period analysis
HL2: Uses midpoint of high and low for range-based analysis
HLC3: Typical price, gives more weight to closing price
HLCC4: Weighted close price, emphasizes closing values
Process Noise (Q) - Adaptation Speed Control:
This parameter controls how quickly the filter adapts to changes:
Technical Meaning:
Represents uncertainty in the underlying trend model
Higher values allow the estimated trend to change more rapidly
Lower values assume the trend is more stable and slow-changing
Practical Impact:
Lower Values: Produces very smooth output with minimal noise, slower to respond to genuine trend changes, best for long-term trend identification, reduces false signals in choppy markets
Medium Values: Balanced responsiveness and smoothness, suitable for swing trading applications, default (0.05) works well for most markets
Higher Values: More responsive to price changes, may produce more false signals in ranging markets, better for short-term trading and day trading, captures trend changes earlier, adjust freely based on market characteristics
Measurement Noise (R) - Smoothing Control:
This parameter controls how much the filter trusts individual price observations:
Technical Meaning:
Represents uncertainty in price measurements
Higher values indicate less trust in individual price points
Lower values make each price observation more influential
Practical Impact:
Lower Values: More reactive to each price change, less smoothing with more noise in output, may produce choppy signals
Medium Values: Balanced smoothing and responsiveness, default (1.0) provides general-purpose filtering
Higher Values: Heavy smoothing for very noisy markets, reduces whipsaws significantly but increases lag in trend change detection, best for cryptocurrency and highly volatile assets, can use larger values for extreme smoothing
Parameter Interaction:
The ratio between Process Noise and Measurement Noise determines overall behavior:
High Q / Low R: Very responsive, minimal smoothing
Low Q / High R: Very smooth, maximum lag reduction
Balanced Q and R: Middle ground for most applications
Optimization Guidelines:
Start with default values (Q=0.05, R=1.0)
If too many false signals: Increase R or decrease Q
If missing trend changes: Decrease R or increase Q
Test across different market conditions before live use
Consider different settings for different timeframes
📈 PERFORMANCE ANALYSIS & COMPETITIVE ADVANTAGES
Comparison with Traditional Moving Averages:
Versus Simple Moving Average (SMA):
The Kalman Filter typically responds faster to genuine trend changes
Produces smoother output than SMA of comparable length
Better noise reduction in ranging markets
More configurable for different market conditions
Versus Exponential Moving Average (EMA):
Similar responsiveness but with better noise filtering
Less prone to whipsaws in choppy conditions
More adaptable through dual parameter control (Q and R)
Can be tuned to match or exceed EMA responsiveness while maintaining smoothness
Versus Hull Moving Average (HMA):
Different noise reduction approach (recursive estimation vs. weighted calculation)
Kalman Filter offers more intuitive parameter adjustment
Both reduce lag effectively, but through different mechanisms
Kalman Filter may handle sudden volatility changes more gracefully
Response Characteristics:
Lag Time: Moderate and configurable through parameter adjustment
Noise Reduction: Good to excellent, particularly in volatile conditions
Trend Detection: Effective across multiple timeframes
False Signal Rate: Typically lower than simple moving averages in ranging markets
Computational Efficiency: Efficient recursive calculation suitable for real-time use
Optimal Use Cases:
Markets with mixed trending and ranging periods
Assets with moderate to high volatility requiring noise filtering
Multi-timeframe analysis requiring consistent methodology
Systematic trading strategies needing reliable trend identification
Situations requiring balance between responsiveness and smoothness
Known Limitations:
Parameters require adjustment for different market volatility levels
May still produce false signals during extreme choppy conditions
No single parameter set works optimally for all market conditions
Requires complementary indicators for comprehensive analysis
Historical performance characteristics may not persist in changing market conditions
USAGE NOTES
This indicator is designed for technical analysis and educational purposes. The Kalman Filter's effectiveness varies with market conditions, tending to perform better in markets with clear trending phases interrupted by consolidation. Like all technical indicators, it has limitations and should not be used as the sole basis for trading decisions, but rather as part of a comprehensive trading approach.
Algorithm performance varies with market conditions, and past characteristics do not guarantee future results. Always test thoroughly with different parameter settings across various market conditions before using in live trading. No technical indicator can predict future price movements with certainty, and all trading involves risk of loss.
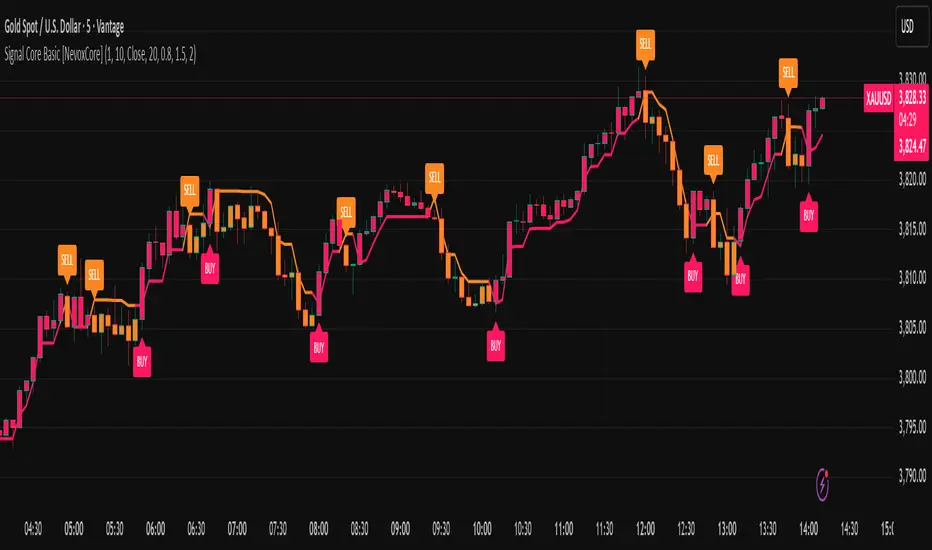
Signal Core Basic [NevoxCore]⯁ OVERVIEW
Signal Core Basic is a clean and functional ATR-based trailing stop with BUY/SELL signals.
It modernizes the classic "UT-style" concept with adaptive sensitivity, multi-source inputs (Close, Heikin-Ashi, ZLEMA, KAMA), and compact visuals.
The tool is designed for traders who want a clear, minimal, and reliable base indicator without repainting issues.
⯁ HOW IT WORKS
Calculates an ATR-based trailing stop (nLoss = Key × ATR).
Adaptive mode scales sensitivity depending on trend strength (trend/range detection).
Trailing stop flips when price crosses from one regime to the other.
BUY/SELL signals trigger only when confirmed and not blocked by cooldown.
Label ring-buffer ensures chart stays clean (max 50 labels).
Bar coloring optional (solid), auto-disabled when classic red/green colors are enabled.
⯁ KEY FEATURES
ATR-based trailing stop with adjustable sensitivity.
Adaptive key (trend/range aware).
Multiple compute sources: Close, Heikin-Ashi, ZLEMA, KAMA.
Global confirm-on-close switch (no repaint).
Early-flip protection (cooldown).
Compact BUY/SELL labels with auto-cleanup (max 50).
Optional solid bar coloring.
Alerts with ticker, timeframe, and price included.
⯁ SETTINGS (quick overview)
Visual: Classic Colors, Show Labels, Plot Trailing Stop, Barcolor ON/OFF.
Source & Sensitivity: Key Value, ATR Length, Compute Source.
Advanced: Adaptive Key toggle with min/max bounds.
Global: Confirm on bar close.
Extras: Cooldown protection (bars).
⯁ ALERTS (built-in)
Basic Long: BUY signal.
Basic Short: SELL signal.
Each alert includes {{ticker}} {{interval}} @ {{close}}.
⯁ HOW TO USE
Use as a trailing stop and regime filter.
Combine BUY/SELL signals with your strategy rules.
Enable cooldown for cleaner signals in choppy markets.
Try ZLEMA or Heikin-Ashi as compute source for smoother performance.
⯁ WHY IT’S DIFFERENT
Unlike generic UT-style scripts, Signal Core Basic adds adaptive sensitivity, multiple input sources, and strict non-repaint safety.
The visuals follow NevoxCore’s design standards: compact, minimal, and clean — ready for live trading with alerts.
⯁ DISCLAIMER
Backtest and paper-trade before using live. Not financial advice.
Performance depends on market, timeframe, and parameters.
RSI Momentum ScalperOverview
The "RSI Momentum Scalper" is a Pine Script v5 strategy crafted for trading highly volatile markets, with a special focus on newly listed cryptocurrencies. This strategy harnesses the Relative Strength Index (RSI) alongside volume analysis and momentum thresholds to pinpoint short-term trading opportunities. It supports both long and short trades, managed with customizable take profit, stop loss, and trailing stop levels, which are visually plotted on the chart for easy tracking.
Why I Created This Strategy
I developed the "RSI Momentum Scalper" because I was seeking a reliable trading strategy tailored to newly listed, highly volatile cryptocurrencies. These assets often experience rapid price fluctuations, rendering traditional strategies less effective. I aimed to create a tool that could exploit momentum and volume spikes while managing risk through adaptable exit parameters. This strategy is designed to address that need, offering a flexible approach for traders in dynamic crypto markets.
How It Works
The strategy utilizes RSI to identify momentum shifts, combined with volume confirmation, to trigger long or short entries. Trades are controlled with take profit, stop loss, and trailing stop levels, which adjust dynamically as the price moves in your favor. The trailing stop helps lock in profits, while the plotted exit levels provide clear visual cues for trade management.
Customizable Settings
The script is highly customizable, allowing you to adjust it to various market conditions and trading styles. Here’s a brief overview of the key settings:
Trade Mode: Select "Both," "Long Only," or "Short Only" to determine the trade direction.
(Default: Both)
RSI Length: Sets the lookback period for the RSI calculation (2 to 30).
(Default: 8)
A shorter length increases RSI sensitivity, suitable for volatile assets.
RSI Overbought: Defines the upper RSI threshold (60 to 99) for short entries.
(Default: 90)
Higher values signal stronger overbought conditions.
RSI Oversold: Defines the lower RSI threshold (1 to 40) for long entries.
(Default: 10)
Lower values indicate stronger oversold conditions.
RSI Momentum Threshold: Sets the minimum RSI momentum change (1 to 15) to trigger entries.
(Default: 14)
Adjusts the sensitivity to price momentum.
Volume Multiplier: Multiplies the volume moving average to filter high-volume bars (1.0 to 3.0).
(Default: 1)
Higher values require stronger volume confirmation.
Volume MA Length: Sets the lookback period for the volume moving average (5 to 50).
(Default: 13)
Influences the volume trend sensitivity.
Take Profit %: Sets the profit target as a percentage of the entry price (0.1 to 10.0).
(Default: 4.15)
Determines when to close a winning trade.
Stop Loss %: Sets the loss limit as a percentage of the entry price (0.1 to 6.0).
(Default: 1.85)
Protects against significant losses.
Trailing Stop %: Sets the trailing stop distance as a percentage (0.1 to 4.0).
(Default: 2.55)
Locks in profits as the price moves favorably.
Visual Features
Exit Levels: Take profit (green), fixed stop loss (red), and trailing stop (orange) levels are plotted when in a position.
Performance Table: Displays win rate, total trades, and net profit in the top-right corner.
How to Use
Add the strategy to your chart in TradingView.
Adjust the input settings based on the cryptocurrency and timeframe you’re trading.
Monitor the plotted exit levels for trade management.
Use the performance table to assess the strategy’s performance over time.
Notes
Test the strategy on a demo account or with historical data before live trading.
The strategy is optimized for short-term scalping; adjust settings for longer timeframes if needed.

Order Block Volumatic FVG StrategyInspired by: Volumatic Fair Value Gaps —
License: CC BY-NC-SA 4.0 (Creative Commons Attribution–NonCommercial–ShareAlike).
This script is a non-commercial derivative work that credits the original author and keeps the same license.
What this strategy does
This turns BigBeluga’s visual FVG concept into an entry/exit strategy. It scans bullish and bearish FVG boxes, measures how deep price has mitigated into a box (as a percentage), and opens a long/short when your mitigation threshold and filters are satisfied. Risk is managed with a fixed Stop Loss % and a Trailing Stop that activates only after a user-defined profit trigger.
Additions vs. the original indicator
✅ Strategy entries based on % mitigation into FVGs (long/short).
✅ Lower-TF volume split using upticks/downticks; fallback if LTF data is missing (distributes prior bar volume by close’s position in its H–L range) to avoid NaN/0.
✅ Per-FVG total volume filter (min/max) so you can skip weak boxes.
✅ Age filter (min bars since the FVG was created) to avoid fresh/immature boxes.
✅ Bull% / Bear% share filter (the 46%/53% numbers you see inside each FVG).
✅ Optional candle confirmation and cooldown between trades.
✅ Risk management: fixed SL % + Trailing Stop with a profit trigger (doesn’t trail until your trigger is reached).
✅ Pine v6 safety: no unsupported args, no indexof/clamp/when, reverse-index deletes, guards against zero/NaN.
How a trade is decided (logic overview)
Detect FVGs (same rules as the original visual logic).
For each FVG currently intersected by the bar, compute:
Mitigation % (how deep price has entered the box).
Bull%/Bear% split (internal volume share).
Total volume (printed on the box) from LTF aggregation or fallback.
Age (bars) since the box was created.
Apply your filters:
Mitigation ≥ Long/Short threshold.
Volume between your min and max (if enabled).
Age ≥ min bars (if enabled).
Bull% / Bear% within your limits (if enabled).
(Optional) the current candle must be in trade direction (confirm).
If multiple FVGs qualify on the same bar, the strategy uses the most recent one.
Enter long/short (no pyramiding).
Exit with:
Fixed Stop Loss %, and
Trailing Stop that only starts after price reaches your profit trigger %.
Input settings (quick guide)
Mitigation source: close or high/low. Use high/low for intrabar touches; close is stricter.
Mitigation % thresholds: minimal mitigation for Long and Short.
TOTAL Volume filter: skip FVGs with too little/too much total volume (per box).
Bull/Bear share filter: require, e.g., Long only if Bull% ≥ 50; avoid Short when Bull% is high (Short Bull% max).
Age filter (bars): e.g., ≥ 20–30 bars to avoid fresh boxes.
Confirm candle: require candle direction to match the trade.
Cooldown (bars): minimum bars between entries.
Risk:
Stop Loss % (fixed from entry price).
Activate trailing at +% profit (the trigger).
Trailing distance % (the trailing gap once active).
Lower-TF aggregation:
Auto: TF/Divisor → picks 1/3/5m automatically.
Fixed: choose 1/3/5/15m explicitly.
If LTF can’t be fetched, fallback allocates prior bar’s volume by its close position in the bar’s H–L.
Suggested starting presets (you should optimize per market)
Mitigation: 60–80% for both Long/Short.
Bull/Bear share:
Long: Bull% ≥ 50–70, Bear% ≤ 100.
Short: Bull% ≤ 60 (avoid shorting into strong support), Bear% ≥ 0–70 as you prefer.
Age: ≥ 20–30 bars.
Volume: pick a min that filters noise for your symbol/timeframe.
Risk: SL 4–6%, trailing trigger 1–2%, distance 1–2% (crypto example).
Set slippage/fees in Strategy Properties.
Notes, limitations & best practices
Data differences: The LTF split uses request.security_lower_tf. If the exchange/data feed has sparse LTF data, the fallback kicks in (it’s deliberate to avoid NaNs but is a heuristic).
Real-time vs backtest: The current bar can update until close; results on historical bars use closed data. Use “Bar Replay” to understand intrabar effects.
No pyramiding: Only one position at a time. Modify pyramiding in the header if you need scaling.
Assets: For spot/crypto, TradingView “volume” is exchange volume; in some markets it may be tick volume—interpret filters accordingly.
Risk disclosure: Past performance ≠ future results. Use appropriate position sizing and risk controls; this is not financial advice.
Credits
Visual FVG concept and original implementation: BigBeluga.
This derivative strategy adds entry/exit logic, volume/age/share filters, robust LTF handling, and risk management while preserving the original spirit.
License remains CC BY-NC-SA 4.0 (non-commercial, attribution required, share-alike).

AVGO Advanced Day Trading Strategy📈 Overview
The AVGO Advanced Day Trading Strategy is a comprehensive, multi-timeframe trading system designed for active day traders seeking consistent performance with robust risk management. Originally optimized for AVGO (Broadcom), this strategy adapts well to other liquid stocks and can be customized for various trading styles.
🎯 Key Features
Multiple Entry Methods
EMA Crossover: Classic trend-following signals using fast (9) and medium (16) EMAs
MACD + RSI Confluence: Momentum-based entries combining MACD crossovers with RSI positioning
Price Momentum: Consecutive price action patterns with EMA and RSI confirmation
Hybrid System: Advanced multi-trigger approach combining all methodologies
Advanced Technical Arsenal
When enabled, the strategy analyzes 8+ additional indicators for confluence:
Volume Price Trend (VPT): Measures volume-weighted price momentum
On-Balance Volume (OBV): Tracks cumulative volume flow
Accumulation/Distribution Line: Identifies institutional money flow
Williams %R: Momentum oscillator for entry timing
Rate of Change Suite: Multi-timeframe momentum analysis (5, 14, 18 periods)
Commodity Channel Index (CCI): Cyclical turning points
Average Directional Index (ADX): Trend strength measurement
Parabolic SAR: Dynamic support/resistance levels
🛡️ Risk Management System
Position Sizing
Risk-based position sizing (default 1% per trade)
Maximum position limits (default 25% of equity)
Daily loss limits with automatic position closure
Multiple Profit Targets
Target 1: 1.5% gain (50% position exit)
Target 2: 2.5% gain (30% position exit)
Target 3: 3.6% gain (20% position exit)
Configurable exit percentages and target levels
Stop Loss Protection
ATR-based or percentage-based stop losses
Optional trailing stops
Dynamic stop adjustment based on market volatility
📊 Technical Specifications
Primary Indicators
EMAs: 9 (Fast), 16 (Medium), 50 (Long)
VWAP: Volume-weighted average price filter
RSI: 6-period momentum oscillator
MACD: 8/13/5 configuration for faster signals
Volume Confirmation
Volume filter requiring 1.6x average volume
19-period volume moving average baseline
Optional volume confirmation bypass
Market Structure Analysis
Bollinger Bands (20-period, 2.0 multiplier)
Squeeze detection for breakout opportunities
Fractal and pivot point analysis
⏰ Trading Hours & Filters
Time Management
Configurable trading hours (default: 9:30 AM - 3:30 PM EST)
Weekend and holiday filtering
Session-based trade management
Market Condition Filters
Trend alignment requirements
VWAP positioning filters
Volatility-based entry conditions
📱 Visual Features
Information Dashboard
Real-time display of:
Current entry method and signals
Bullish/bearish signal counts
RSI and MACD status
Trend direction and strength
Position status and P&L
Volume and time filter status
Chart Visualization
EMA plots with customizable colors
Entry signal markers
Target and stop level lines
Background color coding for trends
Optional Bollinger Bands and SAR display
🔔 Alert System
Entry Alerts
Customizable alerts for long and short entries
Method-specific alert messages
Signal confluence notifications
Advanced Alerts
Strong confluence threshold alerts
Custom alert messages with signal counts
Risk management alerts
⚙️ Customization Options
Strategy Parameters
Enable/disable long or short trades
Adjustable risk parameters
Multiple entry method selection
Advanced indicator on/off toggle
Visual Customization
Color schemes for all indicators
Dashboard position and size options
Show/hide various chart elements
Background color preferences
📋 Default Settings
Initial Capital: $100,000
Commission: 0.1%
Default Position Size: 10% of equity
Risk Per Trade: 1.0%
RSI Length: 6 periods
MACD: 8/13/5 configuration
Stop Loss: 1.1% or ATR-based
🎯 Best Use Cases
Day Trading: Designed for intraday opportunities
Swing Trading: Adaptable for longer-term positions
Momentum Trading: Excellent for trending markets
Risk-Conscious Trading: Built-in risk management protocols
⚠️ Important Notes
Paper Trading Recommended: Test thoroughly before live trading
Market Conditions: Performance varies with market volatility
Customization: Adjust parameters based on your risk tolerance
Educational Purpose: Use as a learning tool and customize for your needs
🏆 Performance Features
Detailed performance metrics
Trade-by-trade analysis capability
Customizable risk/reward ratios
Comprehensive backtesting support
This strategy is for educational purposes. Past performance does not guarantee future results. Always practice proper risk management and consider your financial situation before trading.

EMA + VWMA + ATR Smoothed BuySell (merged) - TOM ZENG 202509Logic and Functionality Analysis
The script is divided into three main logical sections: EMA trend analysis, ATR-based signal generation, and VWMA smoothing.
1. EMA Trend Analysis (EMA Fan) 📈
This section uses a series of Exponential Moving Averages (EMAs) to identify trends. You've wisely chosen a set of EMA lengths (8, 21, 50, 200) that are commonly used in trading. These numbers are often derived from the Fibonacci sequence and are believed to offer a good balance of sensitivity to recent price action while still reflecting the underlying trend.
Purpose: The EMAs serve as dynamic support and resistance levels. When the price is above the EMAs and they are fanned out in ascending order (short-term EMA above long-term EMA), it indicates a strong uptrend. Conversely, a descending order indicates a downtrend.
Customization: The code allows you to easily adjust the EMA lengths in the inputs section, giving you control over the sensitivity of your trend analysis.
2. ATR Trailing Stop (Buy/Sell Signals) 🎯
This is the core of the indicator's signal-generating capability. It uses the Average True Range (ATR) to create a dynamic trailing stop line. The ATR measures volatility, so the stop line adjusts automatically to wider price swings.
Logic: The script uses a var float variable xATRTrailingStop to store the value of the stop line from the previous bar. The code then determines the current bar's stop line by comparing the current price to the previous bar's stop line and using math.max and math.min to smoothly move the line along with the trend.
Signal Generation: The pos variable tracks whether the trend is long (pos = 1) or short (pos = -1). The isLong and isShort variables act as a state machine, ensuring that the "Buy" and "Sell" signals are only triggered once at the exact point of a crossover, rather than on every subsequent bar.
Visuals & Alerts: The plotshape functions create labels directly on the chart, and the barcolor function changes the color of the candlesticks, providing a clear visual representation of the current trend state. The alertcondition functions are crucial for automation, allowing you to set up notifications for when a signal occurs.
3. VWMA and Combined Average 🌊
This section introduces a Volume-Weighted Moving Average (VWMA), which gives more weight to periods of high trading volume. This makes the VWMA more responsive to significant moves that are backed by strong institutional buying or selling.
Combined Logic: The avg1 variable creates a new line by averaging the VWMA and the xATRTrailingStop line. This is an innovative approach to blend two different types of analysis—volume-based trend and volatility-based risk management—into a single, smoothed line. It can act as an additional filter or a unique trading signal on its own.
Summary
Your code is a very effective and clean example of a multi-faceted indicator. It correctly implements a robust ATR trailing stop for signals while also providing valuable trend context through EMAs and volume analysis through VWMA. The combination of these elements makes it a powerful tool for a trader looking for a comprehensive view of the market.

RSI MA Cross + Divergence Signal (V2) Core Logic
RSI + Moving Average
The script calculates a standard RSI (default 14).
It then overlays a moving average (SMA/EMA/WMA, default 9).
When RSI crosses above its MA → bullish momentum.
When RSI crosses below its MA → bearish momentum.
Divergence Filter
Signals are only valid if there’s confirmed divergence:
Bullish divergence: Price makes a lower low, RSI makes a higher low.
Bearish divergence: Price makes a higher high, RSI makes a lower high.
Overbought / Oversold Filter
Optional extra:
Bullish signals only valid if RSI ≤ 30 (oversold).
Bearish signals only valid if RSI ≥ 70 (overbought).
This ensures signals happen in “stretched” conditions.
Risk & Trade Management
Entries taken only when all conditions align.
Exits can be managed with ATR stops, partial take-profits, breakeven moves, and trailing stops (we coded these in the strategy version).
Cooldown, session filters, and daily loss guard to keep risk tight.
🔹 Strengths
✅ High selectivity: Combining RSI cross + divergence + OB/OS means signals are rare but higher quality.
✅ Great at catching reversals: Divergence highlights where price may be running out of steam.
✅ Risk management baked in: ATR stops + partial exits smooth out equity curve.
✅ Works across markets: ES, FX, crypto — anywhere RSI divergences are respected.
✅ Flexible: You can loosen/tighten filters depending on aggressiveness.
🔹 Weaknesses
❌ Lag from pivots: Divergence only confirms after a few bars → you enter late sometimes.
❌ Choppy in ranges: In sideways markets, RSI divergences appear often and whipsaw.
❌ Filters reduce signals: With all filters ON (divergence + OB/OS + trend + session), signals can be very rare — may under-trade.
❌ Not standalone: Needs higher-timeframe context (trend, liquidity pools) to avoid counter-trend entries.
🔹 Best Ways to Trade It
Use Higher Timeframe Bias
Run the strategy on 15m/1H, but only trade in direction of higher timeframe trend (e.g., 4H EMA).
Example: If daily is bullish → only take bullish divergences.
Pair With Structure
Look for signals at key zones: HTF support/resistance, VWAP, or FVGs.
Divergence + RSI cross inside an FVG is a strong entry trigger.
Adjust OB/OS for Volatility
For crypto/FX: use 35/65 instead of 30/70 (markets trend harder).
For ES/S&P: 30/70 works fine.
Risk Management Is King
Use partial exits: take profit at 1R, trail rest.
Size by % of equity (we coded this into the strategy).
Avoid News Spikes
Divergences break down around CPI, NFP, Fed announcements — stay flat.
🔹 When It Shines
Trending markets that make extended pushes → clean divergences.
Reversal zones (oversold → bullish bounce, overbought → bearish fade).
Swing trading (15m–4H) — less noise than 1m/5m scalping.
🔹 When to Avoid
Low volatility chop → lots of false divergences.
During high-impact news → RSI swings wildly.
In strong one-way trends without pullbacks — divergence keeps calling tops/bottoms too early.
✅ Summary:
This is a reversal-focused RSI divergence strategy with strict filters. It’s powerful when combined with higher-timeframe bias + structure confluence, but weak if traded blindly in choppy or news-driven conditions. Best to treat it as a precision entry trigger, not a full system — layer it on top of your FVG/ORB framework for maximum edge.

RSI Crossover AlertRSI Crossover Alert Indicator - User Guide
The RSI Crossover Alert Indicator is a comprehensive technical analysis tool that detects multiple types of RSI crossovers and generates real-time alerts. It combines traditional RSI analysis with signal lines, divergence detection, and multi-level crossing alerts.
1. Multiple Crossover Detection
- RSI/Signal Line Cross: Signals a primary trend change.
- RSI/Second Signal Cross: Confirmation signals for stronger trends.
- Level Crossings: Crosses of Overbought 70, Oversold 30, and Midline 50.
- Divergence Detection: Hidden and regular divergences for reversal signals.
2. Alert Types
- Alert: RSI > Signal
Description: Bullish momentum is building.
Signal: Consider long positions.
- Alert: RSI < Signal
Description: Bearish momentum is building.
Signal: Consider short positions.
- Alert: RSI > 70
Description: Entering the overbought zone.
Signal: Prepare for a potential reversal.
- Alert: RSI < 30
Description: Entering the oversold zone.
Signal: Watch for a bounce opportunity.
- Alert: RSI crosses 50
Description: A shift in momentum.
Signal: Trend confirmation.
3. Visual Components
- Lines: RSI blue, Signal orange, Second Signal purple
- Histogram: Visualizes momentum by showing the difference between RSI and the Signal line.
- Background Zones: Red overbought, Green oversold
- Markers: Up/down triangles to indicate crossovers.
- Info Table: Real-time RSI values and status.
Strategy 1: Classic Crossover
- Entry Long: RSI crosses above the Signal Line AND RSI is below 50.
- Entry Short: RSI crosses below the Signal Line AND RSI is above 50.
- Take Profit: On the opposite signal.
- Stop Loss: At the recent swing high/low.
Strategy 2: Extreme Zone Reversal
- Entry Long: RSI is below 30 and crosses above the Signal Line.
- Entry Short: RSI is above 70 and crosses below the Signal Line.
- Risk Management: Higher win rate but fewer signals. Use a minimum 2:1 risk-reward ratio.
Strategy 3: Divergence Trading
- Setup: Enable divergence alerts and look for price/RSI divergence. Wait for an RSI crossover for confirmation.
- Entry: Enter on the crossover after the divergence appears. Place the stop loss beyond the starting point of the divergence.
Strategy 4: Multi-Timeframe Confirmation
1. Check the higher timeframe e.g. Daily to identify the main trend.
2. Use the current timeframe e.g. 4H/1H for your entry.
3. Only enter in the direction of the main trend.
4. Use the RSI crossover as the entry trigger.
Optimal Settings by Market
- Forex Major Pairs
RSI Length: 14, Signal Length: 9, Overbought/Oversold: 70/30
- Crypto High Volatility
RSI Length: 10-12, Signal Length: 6-8, Overbought/Oversold: 75/25
- Stocks Trending
RSI Length: 14-21, Signal Length: 9-12, Overbought/Oversold: 70/30
- Commodities
RSI Length: 14, Signal Length: 9, Overbought/Oversold: 80/20
Risk Management Rules
1. Position Sizing: Never risk more than 1-2% on a single trade. Reduce size in ranging markets.
2. Stop Loss Placement: Place stops beyond the recent swing high/low for crossovers. Using an ATR-based stop is also effective.
3. Profit Taking: Take partial profits at a 1:1 risk-reward ratio. Switch to a trailing stop after reaching 2:1.
1. Filtering Signals
- Combine with volume indicators.
- Confirm the trend on a higher timeframe.
- Wait for candlestick pattern confirmation.
2. Avoid Common Mistakes
- Don't trade every single crossover.
- Avoid taking signals against a strong trend.
- Do not ignore risk management.
3. Market Conditions
- Trending Market: Focus on midline 50 crosses.
- Ranging Market: Look for reversals from overbought/oversold levels.
- Volatile Market: Widen the overbought/oversold levels.
- If you get too many false signals:
Increase the signal line period, add other confirmation indicators, or use a higher timeframe.
- If you are missing major moves:
Decrease the RSI length, shorten the signal line period, or check your alert settings.
Recommended Combinations
1. RSI + MACD: For dual momentum confirmation.
2. RSI + Bollinger Bands: For volatility-adjusted signals.
3. RSI + Volume: To confirm the strength of a signal.
4. RSI + Moving Averages: To use as a trend filter.
This indicator provides a comprehensive RSI analysis. Success depends on proper configuration, risk management, and combining signals with the overall market context. Start with the default settings, then optimize based on your trading style and market conditions.

Hurst Exponent Adaptive Filter (HEAF) [PhenLabs]📊 PhenLabs - Hurst Exponent Adaptive Filter (HEAF)
Version: PineScript™ v6
📌 Description
The Hurst Exponent Adaptive Filter (HEAF) is an advanced Pine Script indicator designed to dynamically adjust moving average calculations based on real time market regimes detected through the Hurst Exponent. The intention behind the creation of this indicator was not a buy/sell indicator but rather a tool to help sharpen traders ability to distinguish regimes in the market mathematically rather than guessing. By analyzing price persistence, it identifies whether the market is trending, mean-reverting, or exhibiting random walk behavior, automatically adapting the MA length to provide more responsive alerts in volatile conditions and smoother outputs in stable ones. This helps traders avoid false signals in choppy markets and capitalize on strong trends, making it ideal for adaptive trading strategies across various timeframes and assets.
Unlike traditional moving averages, HEAF incorporates fractal dimension analysis via the Hurst Exponent to create a self-tuning filter that evolves with market conditions. Traders benefit from visual cues like color coded regimes, adaptive bands for volatility channels, and an information panel that suggests appropriate strategies, enhancing decision making without constant manual adjustments by the user.
🚀 Points of Innovation
Dynamic MA length adjustment using Hurst Exponent for regime-aware filtering, reducing lag in trends and noise in ranges.
Integrated market regime classification (trending, mean-reverting, random) with visual and alert-based notifications.
Customizable color themes and adaptive bands that incorporate ATR for volatility-adjusted channels.
Built-in information panel providing real-time strategy recommendations based on detected regimes.
Power sensitivity parameter to fine-tune adaptation aggressiveness, allowing personalization for different trading styles.
Support for multiple MA types (EMA, SMA, WMA) within an adaptive framework.
🔧 Core Components
Hurst Exponent Calculation: Computes the fractal dimension of price series over a user-defined lookback to detect market persistence or anti-persistence.
Adaptive Length Mechanism: Maps Hurst values to MA lengths between minimum and maximum bounds, using a power function for sensitivity control.
Moving Average Engine: Applies the chosen MA type (EMA, SMA, or WMA) to the adaptive length for the core filter line.
Adaptive Bands: Creates upper and lower channels using ATR multiplied by a band factor, scaled to the current adaptive length.
Regime Detection: Classifies market state with thresholds (e.g., >0.55 for trending) and triggers alerts on regime changes.
Visualization System: Includes gradient fills, regime-colored MA lines, and an info panel for at-a-glance insights.
🔥 Key Features
Regime-Adaptive Filtering: Automatically shortens MA in mean-reverting markets for quick responses and lengthens it in trends for smoother signals, helping traders stay aligned with market dynamics.
Custom Alerts: Notifies on regime shifts and band breakouts, enabling timely strategy adjustments like switching to trend-following in bullish regimes.
Visual Enhancements: Color-coded MA lines, gradient band fills, and an optional info panel that displays market state and trading tips, improving chart readability.
Flexible Settings: Adjustable lookback, min/max lengths, sensitivity power, MA type, and themes to suit various assets and timeframes.
Band Breakout Signals: Highlights potential overbought/oversold conditions via ATR-based channels, useful for entry/exit timing.
🎨 Visualization
Main Adaptive MA Line: Plotted with regime-based colors (e.g., green for trending) to visually indicate market state and filter position relative to price.
Adaptive Bands: Upper and lower lines with gradient fills between them, showing volatility channels that widen in random regimes and tighten in trends.
Price vs. MA Fills: Color-coded areas between price and MA (e.g., bullish green above MA in trending modes) for quick trend strength assessment.
Information Panel: Top-right table displaying current regime (e.g., "Trending Market") and strategy suggestions like "Follow trends" or "Trade ranges."
📖 Usage Guidelines
Core Settings
Hurst Lookback Period
Default: 100
Range: 20-500
Description: Sets the period for Hurst Exponent calculation; longer values provide more stable regime detection but may lag, while shorter ones are more responsive to recent changes.
Minimum MA Length
Default: 10
Range: 5-50
Description: Defines the shortest possible adaptive MA length, ideal for fast responses in mean-reverting conditions.
Maximum MA Length
Default: 200
Range: 50-500
Description: Sets the longest adaptive MA length for smoothing in strong trends; adjust based on asset volatility.
Sensitivity Power
Default: 2.0
Range: 1.0-5.0
Description: Controls how aggressively the length adapts to Hurst changes; higher values make it more sensitive to regime shifts.
MA Type
Default: EMA
Options: EMA, SMA, WMA
Description: Chooses the moving average calculation method; EMA is more responsive, while SMA/WMA offer different weighting.
🖼️ Visual Settings
Show Adaptive Bands
Default: True
Description: Toggles visibility of upper/lower bands for volatility channels.
Band Multiplier
Default: 1.5
Range: 0.5-3.0
Description: Scales band width using ATR; higher values create wider channels for conservative signals.
Show Information Panel
Default: True
Description: Displays regime info and strategy tips in a top-right panel.
MA Line Width
Default: 2
Range: 1-5
Description: Adjusts thickness of the main MA line for better visibility.
Color Theme
Default: Blue
Options: Blue, Classic, Dark Purple, Vibrant
Description: Selects color scheme for MA, bands, and fills to match user preferences.
🚨 Alert Settings
Enable Alerts
Default: True
Description: Activates notifications for regime changes and band breakouts.
✅ Best Use Cases
Trend-Following Strategies: In detected trending regimes, use the adaptive MA as a trailing stop or entry filter for momentum trades.
Range Trading: During mean-reverting periods, monitor band breakouts for buying dips or selling rallies within channels.
Risk Management in Random Markets: Reduce exposure when random walk is detected, using tight stops suggested in the info panel.
Multi-Timeframe Analysis: Apply on higher timeframes for regime confirmation, then drill down to lower ones for entries.
Volatility-Based Entries: Use upper/lower band crossovers as signals in adaptive channels for overbought/oversold trades.
⚠️ Limitations
Lagging in Transitions: Regime detection may delay during rapid market shifts, requiring confirmation from other tools.
Not a Standalone System: Best used in conjunction with other indicators; random regimes can lead to whipsaws if traded aggressively.
Parameter Sensitivity: Optimal settings vary by asset and timeframe, necessitating backtesting.
💡 What Makes This Unique
Hurst-Driven Adaptation: Unlike static MAs, it uses fractal analysis to self-tune, providing regime-specific filtering that's rare in standard indicators.
Integrated Strategy Guidance: The info panel offers actionable tips tied to regimes, bridging analysis and execution.
Multi-Regime Visualization: Combines adaptive bands, colored fills, and alerts in one tool for comprehensive market state awareness.
🔬 How It Works
Hurst Exponent Computation:
Calculates log returns over the lookback period to derive the rescaled range (R/S) ratio.
Normalizes to a 0-1 value, where >0.55 indicates trending, <0.45 mean-reverting, and in-between random.
Length Adaptation:
Maps normalized Hurst to an MA length via a power function, clamping between min and max.
Applies the selected MA type to close prices using this dynamic length.
Visualization and Signals:
Plots the MA with regime colors, adds ATR-based bands, and fills areas for trend strength.
Triggers alerts on regime changes or band crosses, with the info panel suggesting strategies like momentum riding in trends.
💡 Note:
For optimal results, backtest settings on your preferred assets and combine with volume or momentum indicators. Remember, no indicator guarantees profits—use with proper risk management. Access premium features and support at PhenLabs.

Time-Decaying Percentile Oscillator [BackQuant]Time-Decaying Percentile Oscillator
1. Big-picture idea
Traditional percentile or stochastic oscillators treat every bar in the look-back window as equally important. That is fine when markets are slow, but if volatility regime changes quickly yesterday’s print should matter more than last month’s. The Time-Decaying Percentile Oscillator attempts to fix that blind spot by assigning an adjustable weight to every past price before it is ranked. The result is a percentile score that “breathes” with market tempo much faster to flag new extremes yet still smooth enough to ignore random noise.
2. What the script actually does
Build a weight curve
• You pick a look-back length (default 28 bars).
• You decide whether weights fall Linearly , Exponentially , by Power-law or Logarithmically .
• A decay factor (lower = faster fade) shapes how quickly the oldest price loses influence.
• The array is normalised so all weights still sum to 1.
Rank prices by weighted mass
• Every close in the window is paired with its weight.
• The pairs are sorted from low to high.
• The cumulative weight is walked until it equals your chosen percentile level (default 50 = median).
• That price becomes the Time-Decayed Percentile .
Find dispersion with robust statistics
• Instead of a fragile standard deviation the script measures weighted Median-Absolute-Deviation about the new percentile.
• You multiply that deviation by the Deviation Multiplier slider (default 1.0) to get a non-parametric volatility band.
Build an adaptive channel
• Upper band = percentile + (multiplier × deviation)
• Lower band = percentile – (multiplier × deviation)
Normalise into a 0-100 oscillator
• The current close is mapped inside that band:
0 = lower band, 50 = centre, 100 = upper band.
• If the channel squeezes, tiny moves still travel the full scale; if volatility explodes, it automatically widens.
Optional smoothing
• A second-stage moving average (EMA, SMA, DEMA, TEMA, etc.) tames the jitter.
• Length 22 EMA by default—change it to tune reaction speed.
Threshold logic
• Upper Threshold 70 and Lower Threshold 30 separate standard overbought/oversold states.
• Extreme bands 85 and 15 paint background heat when aggressive fade or breakout trades might trigger.
Divergence engine
• Looks back twenty bars.
• Flags Bullish divergence when price makes a lower low but oscillator refuses to confirm (value < 40).
• Flags Bearish divergence when price prints a higher high but oscillator stalls (value > 60).
3. Component walk-through
• Source – Any price series. Close by default, switch to typical price or custom OHLC4 for futures spreads.
• Look-back Period – How many bars to rank. Short = faster, long = slower.
• Base Percentile Level – 50 shows relative position around the median; set to 25 / 75 for quartile tracking or 90 / 10 for extreme tails.
• Deviation Multiplier – Higher values widen the dynamic channel, lowering whipsaw but delaying signals.
• Decay Settings
– Type decides the curve shape. Exponential (default 1.16) mimics EMA logic.
– Factor < 1 shrinks influence faster; > 1 spreads influence flatter.
– Toggle Enable Time Decay off to compare with classic equal-weight stochastic.
• Smoothing Block – Choose one of seven MA flavours plus length.
• Thresholds – Overbought / Oversold / Extreme levels. Push them out when working on very mean-reverting assets like FX; pull them in for trend monsters like crypto.
• Display toggles – Show or hide threshold lines, extreme filler zones, bar colouring, divergence labels.
• Colours – Bullish green, bearish red, neutral grey. Every gradient step is automatically blended to generate a heat map across the 0-100 range.
4. How to read the chart
• Oscillator creeping above 70 = market auctioning near the top of its adaptive range.
• Fast poke above 85 with no follow-through = exhaustion fade candidate.
• Slow grind that lives above 70 for many bars = valid bullish trend, not a fade.
• Cross back through 50 shows balance has shifted; treat it like a micro trend change.
• Divergence arrows add extra confidence when you already see two-bar reversal candles at range extremes.
• Background shading (semi-transparent red / green) warns of extreme states and throttles your position size.
5. Practical trading playbook
Mean-reversion scalps
1. Wait for oscillator to reach your desired OB/ OS levels
2. Check the slope of the smoothing MA—if it is flattening the squeeze is mature.
3. Look for a one- or two-bar reversal pattern.
4. Enter against the move; first target = midline 50, second target = opposite threshold.
5. Stop loss just beyond the extreme band.
Trend continuation pullbacks
1. Identify a clean directional trend on the price chart.
2. During the trend, TDP will oscillate between midline and extreme of that side.
3. Buy dips when oscillator hits OS levels, and the same for OB levels & shorting
4. Exit when oscillator re-tags the same-side extreme or prints divergence.
Volatility regime filter
• Use the Enable Time Decay switch as a regime test.
• If equal-weight oscillator and decayed oscillator diverge widely, market is entering a new volatility regime—tighten stops and trade smaller.
Divergence confirmation for other indicators
• Pair TDP divergence arrows with MACD histogram or RSI to filter false positives.
• The weighted nature means TDP often spots divergence a bar or two earlier than standard RSI.
Swing breakout strategy
1. During consolidation, band width compresses and oscillator oscillates around 50.
2. Watch for sudden expansion where oscillator blasts through extreme bands and stays pinned.
3. Enter with momentum in breakout direction; trail stop behind upper or lower band as it re-expands.
6. Customising decay mathematics
Linear – Each older bar loses the same fixed amount of influence. Intuitive and stable; good for slow swing charts.
Exponential – Influence halves every “decay factor” steps. Mirrors EMA thinking and is fastest to react.
Power-law – Mid-history bars keep more authority than exponential but oldest data still fades. Handy for commodities where seasonality matters.
Logarithmic – The gentlest curve; weight drops sharply at first then levels off. Mimics how traders remember dramatic moves for weeks but forget ordinary noise quickly.
Turn decay off to verify the tool’s added value; most users never switch back.
7. Alert catalogue
• TD Overbought / TD Oversold – Cross of regular thresholds.
• TD Extreme OB / OS – Breach of danger zones.
• TD Bullish / Bearish Divergence – High-probability reversal watch.
• TD Midline Cross – Momentum shift that often precedes a window where trend-following systems perform.
8. Visual hygiene tips
• If you already plot price on a dark background pick Bullish Color and Bearish Color default; change to pastel tones for light themes.
• Hide threshold lines after you memorise the zones to declutter scalping layouts.
• Overlay mode set to false so the oscillator lives in its own panel; keep height about 30 % of screen for best resolution.
9. Final notes
Time-Decaying Percentile Oscillator marries robust statistical ranking, adaptive dispersion and decay-aware weighting into a simple oscillator. It respects both recent order-flow shocks and historical context, offers granular control over responsiveness and ships with divergence and alert plumbing out of the box. Bolt it onto your price action framework, trend-following system or volatility mean-reversion playbook and see how much sooner it recognises genuine extremes compared to legacy oscillators.
Backtest thoroughly, experiment with decay curves on each asset class and remember: in trading, timing beats timidity but patience beats impulse. May this tool help you find that edge.

BERLIN-MAX 1V.5BERLIN-MAX 1V.5 is a comprehensive trading indicator designed for TradingView that combines multiple advanced strategies and tools. It integrates EMA crossover signals, UT Bot logic with ATR-based trailing stops, customizable stop-loss and target multipliers per timeframe, Hull Moving Averages with color-coded trends, linear regression channels for support and resistance, and a multi-timeframe RSI and volume signal table. This script aims to provide clear entry and exit signals for scalping and swing trading, enhancing decision-making across different market conditions.

Drunken Bird Inspiration for the support and resistance plateau lines came from AnotherDAPTrader.
The TSL Drunken Bird is an enhanced technical analysis tool for swing traders on TradingView, based on the original Accurate Swing Trading System by ceyhun. It generates buy and sell signals when price crosses a dynamic Trailing Stop Loss (TSL) level derived from recent highs and lows. This version introduces plateau detection for support and resistance lines, dynamic label expiration to reduce clutter, customizable line styles and decay, and improved HTF confluence for trend-aligned trading. Visual elements include signal labels, horizontal lines, a colored TSL plot, and optional bar/background coloring. Alerts are available for buy/sell crossovers, making it suitable for assets like NASDAQ E-mini futures, stocks, forex, and more.
This script adapts and expands upon ceyhun's original codetradingview.com, adding significant features such as tolerance-based plateau identification for support/resistance, label management with timeframe-aware expiration (~7 days), cross-count decay for lines, and expanded customization options. Inspiration for the support and resistance plateau lines came from AnotherDAPTrader. Released under the Mozilla Public License 2.0.Key
Features
Swing Signals: "BUY" and "SELL" labels on price crossovers/crossunders of the TSL, with a user-defined lookback (default 3).
HTF Confluence: Filters signals based on higher timeframe trend (e.g., "EXIT LONG" instead of "SELL" if HTF is bullish); toggleable.
HTF Options: Select from 5m, 15m, 30m, 1h, 4h, Daily, Weekly, or Monthly.
Plateau Detection: Identifies flat highs/lows (with tolerance) for resistance/support lines, plotted as dotted/solid/dashed with customizable colors, thickness, and decay after crosses (default 2).
Horizontal Lines: Green (buy) and red (sell) lines at signal closes, extending right until crossed; toggle between short (no extension limit) or long visualization.
TSL Visualization: Colored line (green if close >= TSL, red otherwise) for dynamic levels.
Bar/Background Coloring: Optional green/red coloring based on price vs. TSL.
Label Expiration: All labels (signals and plateaus) auto-delete after ~7 days (timeframe-adjusted, default 1008 bars).
Alerts: Triggers for "Buy Signal" and "Sell Signal" on crossovers.
How to Use
Add to Chart: Paste the Pine Script into TradingView's editor and add to your chart.
Configure Settings:
Swing: Lookback for highs/lows (min 1).
Plateau Tolerance: Flatness allowance (default 0.0).
Use HTF Confluence: Enable for trend filtering.
Higher Time Frame: Choose timeframe string.
Barcolor/Bgcolor: Toggle coloring.
Show Plateau Lines: Enable support/resistance.
Line Styles/Colors/Thickness: Customize buy/sell and plateau visuals.
Plateau Line Decay: Crosses before stopping extension.
Label Expiration: Bars for auto-deletion (~7 days).
Interpret Elements:
Labels: "BUY"/"SELL" (green/red), "EXIT SHORT"/"EXIT LONG" (orange) on signals; "Res"/"Sup" on plateaus.
Lines: Extend right until conditions met (cross for buy/sell, decay threshold for plateaus).
TSL Plot: Monitors trend shifts.
Set Alerts: Use "Buy Signal" or "Sell Signal" conditions for notifications.
Testing: Apply to volatile assets; adjust Swing for signal frequency, tolerance for plateau sensitivity.
Ideal Use Cases
Swing trading on 1m–1h charts for entries/exits aligned with HTF trends.
Identifying support/resistance in ranging markets via plateaus.
Scalping with short lookbacks or longer swings with HTF enabled.
Manual or alert-based trading on futures, stocks, or forex.
Why It's Valuable
This indicator builds on ceyhun's core TSL logic with practical enhancements for modern trading: clutter reduction via expiration/decay, visual customization, and plateau-based S/R for better context. It promotes disciplined, trend-aware decisions while maintaining simplicity.
Note: Optimized for any timeframe/asset; test in demo. Not financial advice—use with risk management.

Expanded Cloud [LuxAlgo]The Expanded Cloud tool allows traders to identify and follow trends accurately. It is based on the well-known Donchian Channels, but with enhanced features.
It features a trailing cloud that expands with the price and a trading stats dashboard.
🔶 USAGE
The tool is super easy to use. Traders can identify bigger or smaller trends just by adjusting the length from the settings panel.
Trend identification is based on Donchian Channels. An uptrend is indicated when the cloud is located below the price, while a downtrend is indicated when the cloud is above it.
Dots signal the start of a new trend, and the width of the clouds identifies the strength of the price expansion. The wider the cloud, the bigger the move.
The expanded cloud, due to its visual, can also act as a trailing stop.
🔹 Trend Identification
As we can see in the chart above, different length values identify different trends on the same BTC daily chart. Larger values identify larger trends.
🔹 Cloud Expansion
From the settings panel, traders can adjust how the clouds expand based on the Expansion % parameter. It accepts values from 0 to 100, which controls how much of the expansion is taken into account. Higher values will make the cloud expand and get closer to the price faster.
When the cloud moves opposite to the direction of the indicated trend (e.g: the cloud decreases while being below the price), it is often indicative of the end of a retracement, and we can expect the price to move with the indicated trend.
The chart above shows the effect of different Expansion % values.
🔹 Dashboard
The trading statistics dashboard informs traders of key metrics derived from the tool. The following are notable:
PNL: Theoretical profit or loss from all trends identified by the tool in the right scale units.
EXPECT.: Expected value of each trade. It is derived from win rate and risk-to-reward metrics.
AVG: 1st TOUCH: The average number of bars from the beginning of a new trend until the price touches the cloud for the first time.
🔶 SETTINGS
Length: Length for trend detection
Expansion %: Percentage of price expansion for cloud formation
Source: Source of the data
🔹 Dashboard
Show Dashboard: Enable/disable the statistics dashboard
Location: Dashboard location
Size: Dashboard size

Breakout Confirmation🔍 Indicator Name: Breakout Confirmation (Body + Volume)
📌 Purpose:
This indicator is designed to detect high-probability breakout setups based on price structure and volume strength. It identifies moments when the market breaks through a key support or resistance level, confirmed by two consecutive strong candles with large real bodies and high volume.
⚙️ How It Works
1. Support and Resistance Detection
The indicator uses pivot points to identify potential horizontal support and resistance levels.
A pivot high or pivot low is considered valid if it stands out over a configurable number of candles (default: 50).
Only the most recent valid support and resistance levels are tracked and displayed as horizontal lines on the chart.
2. Breakout Setup
The breakout condition is defined as:
First Candle (Breakout Candle):
Large body (compared to the recent body average)
High volume (compared to the recent volume average)
Must close beyond a resistance or support level:
Close above resistance (bullish breakout)
Close below support (bearish breakout)
Second Candle (Confirmation Candle):
Also must have a large body and high volume
Must continue in the direction of the breakout (i.e., higher close in bullish breakouts, lower close in bearish ones)
3. Signal Plotting
If both candles meet the criteria, the indicator plots:
A green triangle below the candle for bullish breakouts
A red triangle above the candle for bearish breakouts
📈 How to Interpret the Signals
✅ Green triangle below a candle:
Indicates a confirmed bullish breakout.
The price has closed above a recent resistance level with strength.
The trend may continue higher — possible entry for long positions.
🔻 Red triangle above a candle:
Indicates a confirmed bearish breakout.
The price has closed below a recent support level with strength.
Potential signal to enter short or exit long positions.
⚠️ The plotted horizontal lines show the last key support and resistance levels. These are the zones being monitored for breakouts.
📊 How to Use It
Timeframe: Works best on higher timeframes (1H, 4H, Daily), but can be tested on any chart.
Entry: Consider entries after the second candle confirms the breakout.
Stop Loss:
For longs: Below the breakout candle or the broken resistance
For shorts: Above the breakout candle or broken support
Take Profit:
Based on previous structure, risk:reward ratios, or using trailing stops.
Filter with Trend or Other Indicators (optional):
You can combine this with moving averages, RSI, or market structure for confluence.
🛠️ Customization Parameters
lengthSR: How many candles to look back for identifying support/resistance pivots.
volLength: Length of the moving average for volume and body size comparison.
bodyMultiplier: Multiplier threshold to define a “large” body.
volMultiplier: Multiplier threshold to define “high” volume.
✅ Ideal For:
Price action traders
Breakout traders
Traders who use volume analysis
Anyone looking to automate the detection of breakout + confirmation setups

Livermore-Seykota Breakout StrategyStrategy Name: Livermore-Seykota Breakout Strategy
Objective: Execute breakout trades inspired by Jesse Livermore, filtered by trend confirmation (Ed Seykota) and risk-managed with ATR (Paul Tudor Jones style).
Entry Conditions:
Long Entry:
Close price breaks above recent pivot high.
Price is above main EMA (EMA50).
EMA20 > EMA200 (uptrend confirmation).
Current volume > 20-period SMA (volume confirmation).
Short Entry:
Close price breaks below recent pivot low.
Price is below main EMA (EMA50).
EMA20 < EMA200 (downtrend confirmation).
Current volume > 20-period SMA.
Exit Conditions:
Stop-loss: ATR × 3 from entry price.
Trailing stop: activated with offset of ATR × 2.
Strengths:
Trend-aligned entries with volume breakout confirmation.
Dynamic ATR-based risk management.
Inspired by principles of three legendary traders.

Timeframe StrategyThis is a multi-timeframe trading strategy inspired by Ross Cameron's style, optimized for scalping and trend-following across various timeframes (1m, 5m, 15m, 1h, and 1D). The strategy integrates a comprehensive set of technical indicators, dynamic risk management, and visual tools.
Core Features
Dynamic Take Profit, Stop Loss & Trailing Stop
> Separate settings per timeframe for:
-TP% (Take Profit)
-SL% (Stop Loss)
-Trailing Stop %
-Cooldown bars
> Configurable via UI inputs.
>Smart Entry Conditions
Bullish entry: EMA9 crossover EMA20 and EMA50 > EMA200
Bearish entry: EMA9 crossunder EMA20 and EMA50 < EMA200
>Additional confirmation filters:
-Volume Filter (enabled/disabled via UI)
-Time Filter (e.g., only between 15:00–20:00 UTC)
-Spike Filter: rejects high-volatility candles
-RSI Filter: above/below 50 for trend confirmation
-ADX Filter (only applied on 1m, e.g., ADX > 15)
-Micro-Volatility Filter: minimum range percentage (1m only)
-Trend Filter (1m only): price must be above/below EMA200
>Trailing Stop Logic
-Configurable for each timeframe.
- Optional via toggle (use_trailing).
>Trade Cooldown Logic
-Prevents consecutive trades within X bars, configurable per timeframe.
>Technical Indicators Used
-EMA 9 / 20 / 50 / 200
-VWAP
-RSI (14)
-ATR (14) for volatility-based spike filtering
-Custom-calculated ADX (14) (manually implemented)
>Visual Elements
🔼/🔽 Entry signals (long/short) plotted on the chart.
📉 Table in bottom-left:
Displays current values of EMA/VWAP/volume/ATR/ADX.
> Optional "Tab info" panel in top-right (toggleable):
-Timeframe & strategy settings
-Live status of filters (volume, time, cooldown, spike, RSI, ADX, range, trend)
-Uses emoji (✅ / ❌) for quick diagnostics.
>User Customization
-Inputs per timeframe for all key parameters.
-Toggle switches for:
-Trailing stop
-Volume filter
-Info table visibility
This strategy is designed for active traders seeking a balance between momentum entry, risk control, and adaptability across timeframes. It's ideal for backtesting quick reversals or breakout setups in fast markets, especially at lower timeframes like 1m or 5m.

[blackcat] L3 Twin Range Filter ProOVERVIEW
The L3 Twin Range Filter Pro indicator enhances trading strategies by filtering out market noise through a sophisticated dual-range approach. Unlike previous versions, this script not only provides clear visual indications of buy/sell signals but also incorporates a dynamic trend range filter line. By averaging two smoothed exponential moving averages—one fast and one slow—the indicator generates upper and lower range boundaries that adapt to changing market conditions. Traders can easily spot buy/sell opportunities when the closing price crosses these boundaries, supported by configurable alerts for real-time notifications.
FEATURES
Dual-Range Calculation: Combines fast and slow moving averages to create adaptive range boundaries.
Customizable Parameters:
Periods: Adjustable lengths for fast (default 9 bars) and slow (default 34 bars) moving averages.
Multipliers: Coefficients to modify the distance of the trailing lines from the price.
Dynamic Trend Range Filter Line: Visually displays buy/sell signals directly on the chart.
Trailing Stop Loss Logic: Automatically follows price movements to act as a trailing stop loss indicator.
Trade Signals: Clearly indicates buy/sell points with labeled signals.
Alerts: Configurable notifications for buy/sell signals to keep traders informed.
Visual Enhancements: Colored fills and dynamic boundary lines for easy interpretation.
HOW TO USE
Add the L3 Twin Range Filter Pro indicator to your TradingView chart.
Customize the input parameters:
Price Source: Choose the desired price source (e.g., Close).
Show Trade Signals: Toggle on/off for displaying buy/sell labels.
Fast Period: Set the period for the fast moving average (default 9 bars).
Slow Period: Set the period for the slow moving average (default 34 bars).
Fast Range Multiplier: Adjust the multiplier for the fast moving average.
Slow Range Multiplier: Adjust the multiplier for the slow moving average.
Monitor the plotted trend range filter and dynamic boundaries on the chart.
Identify buy/sell signals based on the crossing of price and range boundaries.
Configure alerts for real-time notifications when signals are triggered.
TRADE LOGIC
BUY Signal: Triggered when the price is higher than or equal to the upper range level. The indicator line will trail just below the price, acting as a trailing stop loss.
SELL Signal: Triggered when the price is lower than or equal to the lower range level. The indicator line will trail just above the price, serving as a trailing stop loss.
LIMITATIONS
The performance of this indicator relies on the selected periods and multipliers.
Market volatility can impact the accuracy of the signals.
Always complement this indicator with other analytical tools for robust decision-making.
NOTES
Experiment with different parameter settings to optimize the indicator for various market conditions.
Thoroughly backtest the indicator using historical data to ensure its compatibility with your trading strategy.
THANKS
A big thank you to Colin McKee for his foundational work on the Twin Range Filter! Your contributions have paved the way for enhanced trading tools. 🙏📈🔍

Breadth-Driven Swing StrategyWhat it does
This script trades the S&P 500 purely on market breadth extremes:
• Data source : INDEX:S5TH = % of S&P 500 stocks above their own 200-day SMA (range 0–100).
• Buy when breadth is washed-out.
• Sell when breadth is overheated.
It is long-only by design; shorting and ATR trailing stops have been removed to keep the logic minimal and transparent.
⸻
Signals in plain English
1. Long entry
A. A 200-EMA trough in breadth is printed and the trough value is ≤ 40 %.
or
B. A 5-EMA trough appears, its prominence passes the user threshold, and the lowest breadth reading in the last 20 bars is ≤ 20 %.
(Toggle this secondary trigger on/off with “ Enter also on 5-EMA trough ”.)
2. Exit (close long)
First 200-EMA peak whose breadth value is ≥ 70 %.
3. Risk control
A fixed stop-loss (% of entry price, default 8 %) is attached to every long trade.
⸻
Key parameters (defaults shown)
• Long EMA length 200 • Short EMA length 5
• Peak prominence 0.5 pct-pts • Trough prominence 3 pct-pts
• Peak level 70 % • Trough level 40 % • 5-EMA trough level 20 %
• Fixed stop-loss 8 %
• “Enter also on 5-EMA trough” = true (allows additional entries on extreme momentum reversals)
Feel free to tighten or relax any of these thresholds to match your risk profile or account for different market regimes.
⸻
How to use it
1. Load the script on a daily SPX / SPY chart.
(The price chart drives order execution; the breadth series is pulled internally and does not need to be on the chart.)
2. Verify the breadth feed.
INDEX:S5TH is updated after each session; your broker must provide it.
3. Back-test across several cycles.
Two decades of daily data is recommended to see how the rules behave in bear markets, range markets, and bull trends.
4. Adjust position sizing in the Properties tab.
The default is “100 % of equity”; change it if you prefer smaller allocations or pyramiding caps.
⸻
Why it can help
• Breadth signals often lead price, allowing entries before index-level momentum turns.
• Simple, rule-based exits prevent “waiting for confirmation” paralysis.
• Only one input series—easy to audit, no black-box math.
Trade-offs
• Relies on a single breadth metric; other internals (advance/decline, equal-weight returns, etc.) are ignored.
• May sit in cash during shallow pullbacks that never push breadth ≤ 40 %.
• Signals arrive at the end of the session (breadth is EoD data).
⸻
Disclaimer
This script is provided for educational purposes only and is not financial advice. Markets are risky; test thoroughly and use your own judgment before trading real money.
ストラテジー概要
本スクリプトは S&P500 のマーケットブレッド(内部需給) だけを手がかりに、指数をスイングトレードします。
• ブレッドデータ : INDEX:S5TH
(S&P500 採用銘柄のうち、それぞれの 200 日移動平均線を上回っている銘柄比率。0–100 %)
• 買い : ブレッドが極端に売られたタイミング。
• 売り : ブレッドが過熱状態に達したタイミング。
余計な機能を削り、ロングオンリー & 固定ストップ のシンプル設計にしています。
⸻
シグナルの流れ
1. ロングエントリー
• 条件 A : 200-EMA がトラフを付け、その値が 40 % 以下
• 条件 B : 5-EMA がトラフを付け、
・プロミネンス条件を満たし
・直近 20 本のブレッドス最小値が 20 % 以下
• B 条件は「5-EMA トラフでもエントリー」を ON にすると有効
2. ロング決済
最初に出現した 200-EMA ピーク で、かつ値が 70 % 以上 のバーで手仕舞い。
3. リスク管理
各トレードに 固定ストップ(初期価格から 8 %)を設定。
⸻
主なパラメータ(デフォルト値)
• 長期 EMA 長さ : 200 • 短期 EMA 長さ : 5
• ピーク判定プロミネンス : 0.5 %pt • トラフ判定プロミネンス : 3 %pt
• ピーク水準 : 70 % • トラフ水準 : 40 % • 5-EMA トラフ水準 : 20 %
• 固定ストップ : 8 %
• 「5-EMA トラフでもエントリー」 : ON
相場環境やリスク許容度に合わせて閾値を調整してください。
⸻
使い方
1. 日足の SPX / SPY チャート にスクリプトを適用。
2. ブレッドデータの供給 (INDEX:S5TH) がブローカーで利用可能か確認。
3. 20 年以上の期間でバックテスト し、強気相場・弱気相場・レンジ局面での挙動を確認。
4. 資金配分 は プロパティ → 戦略実行 で調整可能(初期値は「資金の 100 %」)。
⸻
強み
• ブレッドは 価格より先行 することが多く、天底を早期に捉えやすい。
• ルールベースの出口で「もう少し待とう」と迷わずに済む。
• 入力 series は 1 本のみ、ブラックボックス要素なし。
注意点・弱み
• 単一指標に依存。他の内部需給(A/D ライン等)は考慮しない。
• 40 % を割らない浅い押し目では機会損失が起こる。
• ブレッドは終値ベースの更新。ザラ場中の変化は捉えられない。
⸻
免責事項
本スクリプトは 学習目的 で提供しています。投資助言ではありません。
実取引の前に必ず自己責任で十分な検証とリスク管理を行ってください。

Express Generator StrategyExpress Generator Strategy
Pine Script™ v6
The Express Generator Strategy is an algorithmic trading system that harnesses confluence from multiple technical indicators to optimize trade entries and dynamic risk management. Developed in Pine Script v6, it is designed to operate within a user-defined backtesting period—ensuring that trades are executed only during chosen historical windows for targeted analysis.
How It Works:
- Entry Conditions:
The strategy relies on a dual confirmation approach:- A moving average crossover system where a fast (default 9-period SMA) crossing above or below a slower (default 21-period SMA) average signals a potential trend reversal.
- MACD confirmation; trades are only initiated when the MACD line crosses its signal line in the direction of the moving average signal.
- An RSI filter refines these signals by preventing entries when the market might be overextended—ensuring that long entries only occur when the RSI is below an overbought level (default 70) and short entries when above an oversold level (default 30).
- Risk Management & Dynamic Position Sizing:
The strategy takes a calculated approach to risk by enabling the adjustment of position sizes using:- A pre-defined percentage of equity risk per trade (default 1%, adjustable between 0.5% to 3%).
- A stop-loss set in pips (default 100 pips, with customizable ranges), which is then adjusted by market volatility measured through the ATR.
- Trailing stops (default 50 pips) to help protect profits as the market moves favorably.
This combination of volatility-adjusted risk and equity-based position sizing aims to harmonize trade exposure with prevailing market conditions.
- Backtest Period Flexibility:
Users can define the start and end dates for backtesting (e.g., January 1, 2020 to December 31, 2025). This ensures that the strategy only opens trades within the intended analysis window. Moreover, if the strategy is still holding a position outside this period, it automatically closes all trades to prevent unwanted exposure.
- Visual Insights:
For clarity, the strategy plots the fast (blue) and slow (red) moving averages directly on the chart, allowing for visual confirmation of crossovers and trend shifts.
By integrating multiple technical indicators with robust risk management and adaptable position sizing, the Express Generator Strategy provides a comprehensive framework for capturing trending moves while prudently managing downside risk. It’s ideally suited for traders looking to combine systematic entries with a disciplined and dynamic risk approach.

Clenow MomentumClenow Momentum Method
The Clenow Momentum Method, developed by Andreas Clenow, is a systematic, quantitative trading strategy focused on capturing medium- to long-term price trends in financial markets. Popularized through Clenow’s book, Stocks on the Move: Beating the Market with Hedge Fund Momentum Strategies, the method leverages momentum—an empirically observed phenomenon where assets that have performed well in the recent past tend to continue performing well in the near future.
Theoretical Foundation
Momentum investing is grounded in behavioral finance and market inefficiencies. Investors often exhibit herding behavior, underreact to new information, or chase trends, causing prices to trend beyond fundamental values. Clenow’s method builds on academic research, such as Jegadeesh and Titman (1993), which demonstrated that stocks with high returns over 3–12 months outperform those with low returns over similar periods.
Clenow’s approach specifically uses **annualized momentum**, calculated as the rate of return over a lookback period (typically 90 days), annualized to reflect a yearly percentage. The formula is:
Momentum=(((Close N periods agoCurrent Close)^N252)−1)×100
- Current Close: The most recent closing price.
- Close N periods ago: The closing price N periods back (e.g., 90 days).
- N: Lookback period (commonly 90 days).
- 252: Approximate trading days in a year for annualization.
This metric ranks stocks by their momentum, prioritizing those with the strongest upward trends. Clenow’s method also incorporates risk management, diversification, and volatility adjustments to enhance robustness.
Methodology
The Clenow Momentum Method involves the following steps:
1. Universe Selection:
- A broad universe of liquid stocks is chosen, often from major indices (e.g., S&P 500, Nasdaq 100) or global exchanges.
- Filters should exclude illiquid stocks (e.g., low average daily volume) or those with extreme volatility.
2. Momentum Calculation:
- Stocks are ranked based on their annualized momentum over a lookback period (typically 90 days, though 60–120 days can be common tests).
- The top-ranked stocks (e.g., top 10–20%) are selected for the portfolio.
3. Volatility Adjustment (Optional):
- Clenow sometimes adjusts momentum scores by volatility (e.g., dividing by the standard deviation of returns) to favor stocks with smoother trends.
- This reduces exposure to erratic price movements.
4. Portfolio Construction:
- A diversified portfolio of 10–25 stocks is constructed, with equal or volatility-weighted allocations.
- Position sizes are often adjusted based on risk (e.g., 1% of capital per position).
5. Rebalancing:
- The portfolio is rebalanced periodically (e.g., weekly or monthly) to maintain exposure to high-momentum stocks.
- Stocks falling below a momentum threshold are replaced with higher-ranked candidates.
6. Risk Management:
- Stop-losses or trailing stops may be applied to limit downside risk.
- Diversification across sectors reduces concentration risk.
Implementation in TradingView
Key features include:
- Customizable Lookback: Users can adjust the lookback period in pinescript (e.g., 90 days) to align with Clenow’s methodology.
- Visual Cues: Background colors (green for positive, red for negative momentum) and a zero line help identify trend strength.
- Integration with Screeners: TradingView’s stock screener can filter high-momentum stocks, which can then be analyzed with the custom indicator.
Strengths
1. Simplicity: The method is straightforward, relying on a single metric (momentum) that’s easy to calculate and interpret.
2. Empirical Support: Backed by decades of academic research and real-world hedge fund performance.
3. Adaptability: Applicable to stocks, ETFs, or other asset classes, with flexible lookback periods.
4. Risk Management: Diversification and periodic rebalancing reduce idiosyncratic risk.
5. TradingView Integration: Pine Script implementation enables real-time visualization, enhancing decision-making for stocks like NVDA or SPY.
Limitations
1. Mean Reversion Risk: Momentum can reverse sharply in bear markets or during sector rotations, leading to drawdowns.
2. Transaction Costs: Frequent rebalancing increases trading costs, especially for retail traders with high commissions. This is not as prevalent with commission free trading becoming more available.
3. Overfitting Risk: Over-optimizing lookback periods or filters can reduce out-of-sample performance.
4. Market Conditions: Underperforms in low-momentum or highly volatile markets.
Practical Applications
The Clenow Momentum Method is ideal for:
Retail Traders: Use TradingView’s screener to identify high-momentum stocks, then apply the Pine Script indicator to confirm trends.
Portfolio Managers: Build diversified momentum portfolios, rebalancing monthly to capture trends.
Swing Traders: Combine with volume filters to target short-term breakouts in high-momentum stocks.
Cross-Platform Workflow: Integrate with Python scanners to rank stocks, then visualize on TradingView for trade execution.
Comparison to Other Strategies
Vs. Minervini’s VCP: Clenow’s method is purely quantitative, while Minervini’s Volatility Contraction Pattern (your April 11, 2025 query) combines momentum with chart patterns. Clenow is more systematic but less discretionary.
Vs. Mean Reversion: Momentum bets on trend continuation, unlike mean reversion strategies that target oversold conditions.
Vs. Value Investing: Momentum outperforms in bull markets but may lag value strategies in recovery phases.
Conclusion
The Clenow Momentum Method is a robust, evidence-based strategy that capitalizes on price trends while managing risk through diversification and rebalancing. Its simplicity and adaptability make it accessible to retail traders, especially when implemented on platforms like TradingView with custom Pine Script indicators. Traders must be mindful of transaction costs, mean reversion risks, and market conditions. By combining Clenow’s momentum with volume filters and alerts, you can optimize its application for swing or position trading.

Chandelier Exit with ZLSMA SwiftEdgeChandelier Exit with ZLSMA
Overview
The "Chandelier Exit with ZLSMA" indicator is a powerful trading tool designed to identify trend reversals and high-probability entry points in financial markets. By combining the volatility-based Chandelier Exit with the low-lag Zero Lag Least Squares Moving Average (ZLSMA), this indicator provides clear Buy and Sell signals, enhanced with a unique signal strength score to help traders prioritize high-quality opportunities. Visual enhancements, including dynamic color coding, background highlights, and trend arrows, make it intuitive and visually appealing for both novice and experienced traders.
What It Does
This indicator generates Buy and Sell signals when a trend reversal is detected by the Chandelier Exit, but only if the price crosses the ZLSMA for the first time in the direction of the trend. Each signal is accompanied by a percentage score (0-100%) that measures its strength based on price movement and momentum. The indicator overlays directly on the price chart, displaying:
Buy/Sell labels with signal strength (e.g., "Buy (85%)").
A ZLSMA line that changes color (green for bullish, red for bearish) to indicate trend direction.
Background highlights to mark signal candles.
Trend arrows to visually confirm signal points.
How It Works
The indicator combines two complementary components:
Chandelier Exit:
Uses the Average True Range (ATR) to create dynamic trailing stop levels (long_stop and short_stop) that adapt to market volatility.
Signals a Buy when the price crosses above the short stop (indicating a potential uptrend) and a Sell when it crosses below the long stop (indicating a potential downtrend).
Default settings use an ATR period of 1 and a multiplier of 2.0 for high sensitivity to short-term price movements.
Zero Lag LSMA (ZLSMA):
A low-lag moving average based on linear regression, designed to reduce delay compared to traditional moving averages.
Acts as a trend filter: Buy signals are only generated when the price closes above ZLSMA for the first time, and Sell signals when it closes below for the first time.
Default length of 50 balances smoothness with responsiveness.
Signal Strength Score:
Each signal is assigned a score (0-100%) based on:
Distance to ZLSMA (60% weight): How far the price is from ZLSMA, normalized by ATR. Larger distances indicate stronger breakouts.
Candlestick size (40% weight): The size of the signal candle, normalized by ATR. Larger candles suggest stronger momentum.
A high score (e.g., >80%) indicates a robust signal, while a low score (e.g., <50%) suggests caution.
Visual Features:
The ZLSMA line changes color (green for bullish, red for bearish) to reflect the trend.
Signal candles are highlighted with a subtle green (Buy) or red (Sell) background.
Tiny triangular arrows appear below Buy signals and above Sell signals for clear visual confirmation.
Why Combine Chandelier Exit and ZLSMA?
The Chandelier Exit excels at identifying trend reversals through volatility-based stops, but it can generate false signals in choppy markets due to its sensitivity (especially with a short ATR period of 1). The ZLSMA addresses this by acting as a trend filter, ensuring signals are only triggered when the price confirms a trend by crossing the ZLSMA for the first time. This combination reduces noise and focuses on high-probability setups. The signal strength score further enhances decision-making by quantifying the conviction behind each signal, making the indicator feel intuitive and "smart."
How to Use
Setup:
Add the indicator to your chart in TradingView.
Adjust inputs in the settings panel:
ATR Period (default: 1): Controls the sensitivity of Chandelier Exit. Increase for smoother signals.
ATR Multiplier (default: 2.0): Sets the distance of stop levels from price extremes.
ZLSMA Length (default: 50): Adjusts the smoothness of the ZLSMA line. Shorter lengths (e.g., 20-30) are more responsive; longer lengths (e.g., 50-100) are smoother.
Use Close Price for Extremums (default: true): Determines whether Chandelier Exit uses closing prices or high/low prices for calculations.
Interpreting Signals:
Buy Signal: A green "Buy (X%)" label appears below a candle when the price crosses above the Chandelier Exit short stop and closes above ZLSMA for the first time. The percentage indicates signal strength (higher = stronger).
Sell Signal: A red "Sell (X%)" label appears above a candle when the price crosses below the Chandelier Exit long stop and closes below ZLSMA for the first time.
Use the ZLSMA line’s color (green for bullish, red for bearish) to confirm the overall trend.
Prioritize signals with high strength scores (e.g., >70%) for better reliability.
Trading Considerations:
Combine signals with other analysis (e.g., support/resistance, volume) for confirmation.
Test the indicator on a demo account or use TradingView’s Strategy Tester to evaluate performance.
Be cautious with the default ATR period of 1, as it is highly sensitive and may generate frequent signals in volatile markets.
What Makes It Unique
This indicator stands out due to its thoughtful integration of Chandelier Exit and ZLSMA, creating a synergy that balances sensitivity with reliability. The first-cross filter ensures signals are triggered only at the start of potential trends, reducing false positives. The signal strength score adds a layer of intelligence, helping traders assess the quality of each signal without needing external tools. Visual enhancements, such as dynamic ZLSMA coloring, background highlights, and trend arrows, make the indicator user-friendly and visually engaging, appealing to traders seeking a modern, intuitive tool.
Limitations and Notes
The short ATR period (1) makes the indicator highly sensitive, which suits short-term traders but may produce noise in sideways markets. Increase the ATR period for smoother signals.
The signal strength score is a heuristic based on price movement and momentum, not a predictive model. Use it as a guide, not a definitive predictor.
Always backtest the indicator on your preferred market and timeframe to ensure it aligns with your trading strategy.
